Business
Reports from several departments in one place.
Choose when you still assemble reports by hand.
 ICSInternational Cyber Security
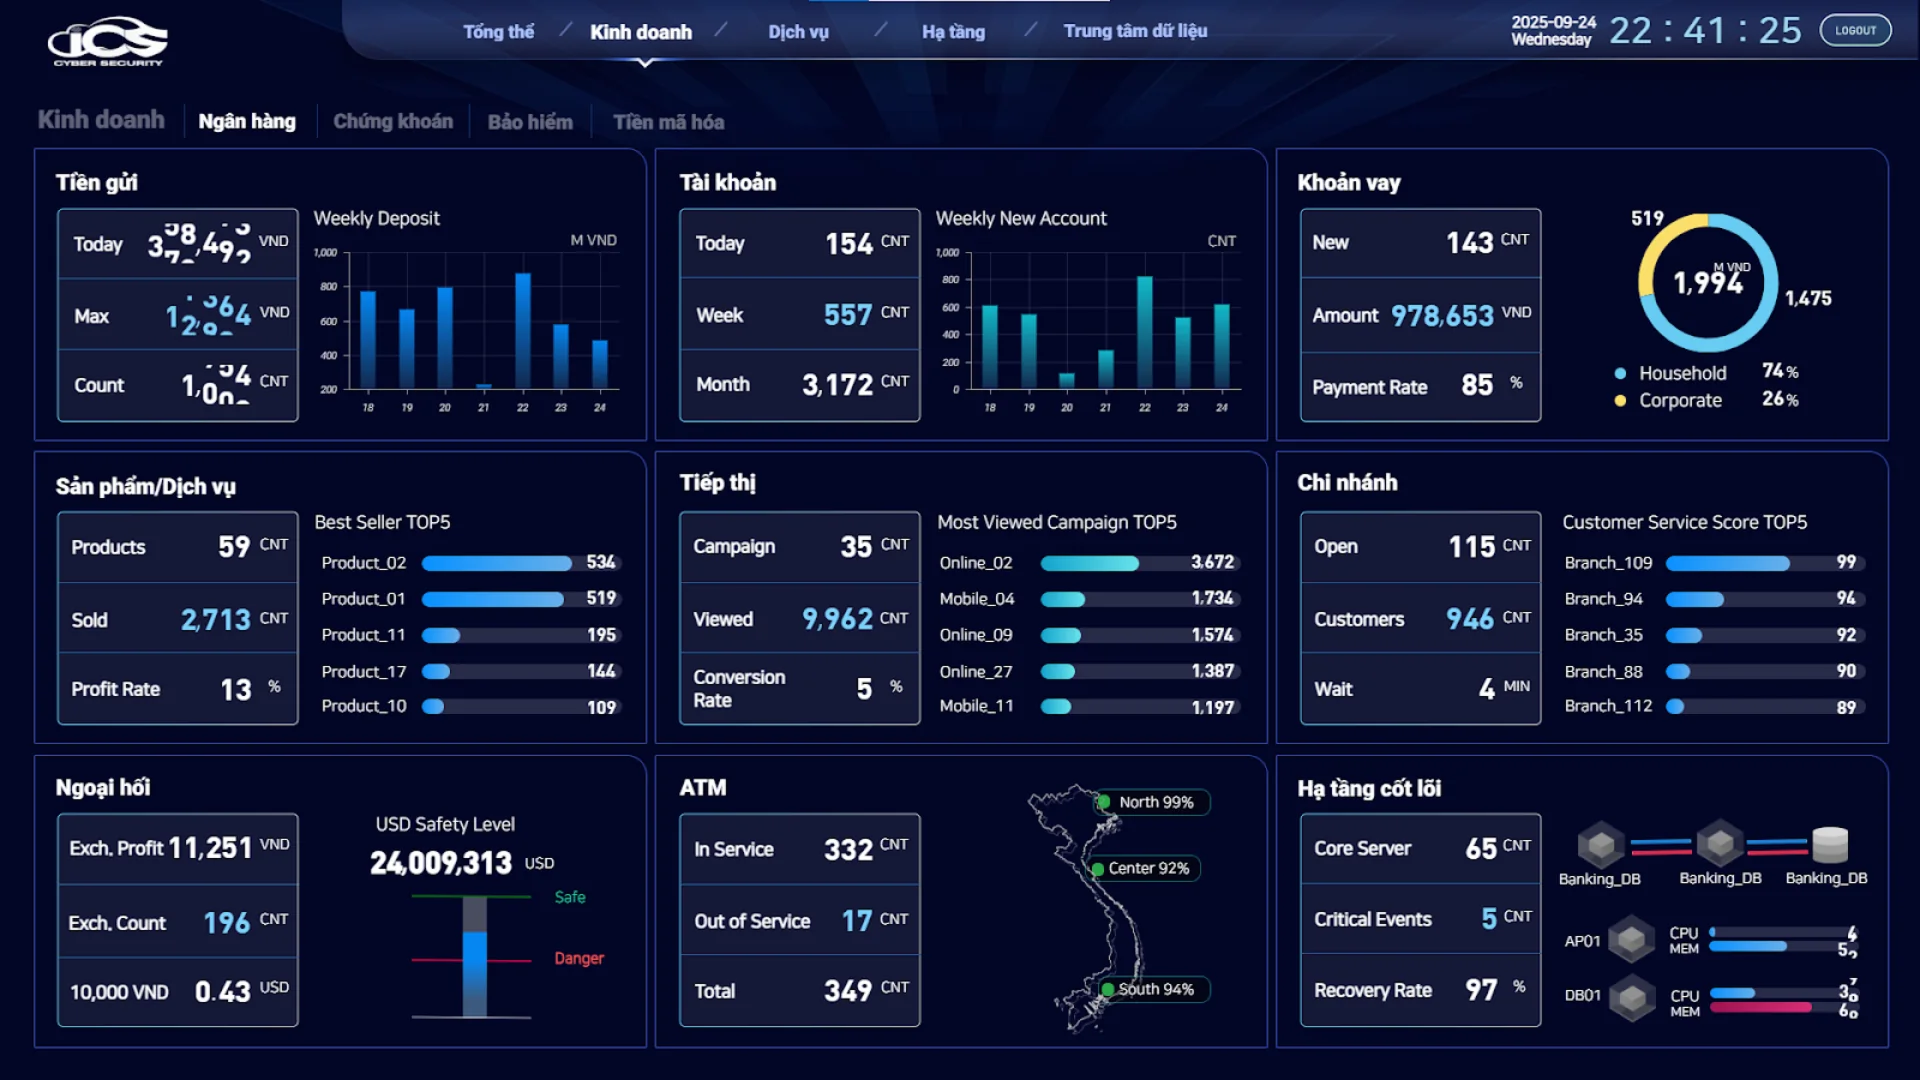
Smart Dashboard connects the databases, ERP, IoT, and BMS you already run, then builds 2D or 3D screens for each operating role.
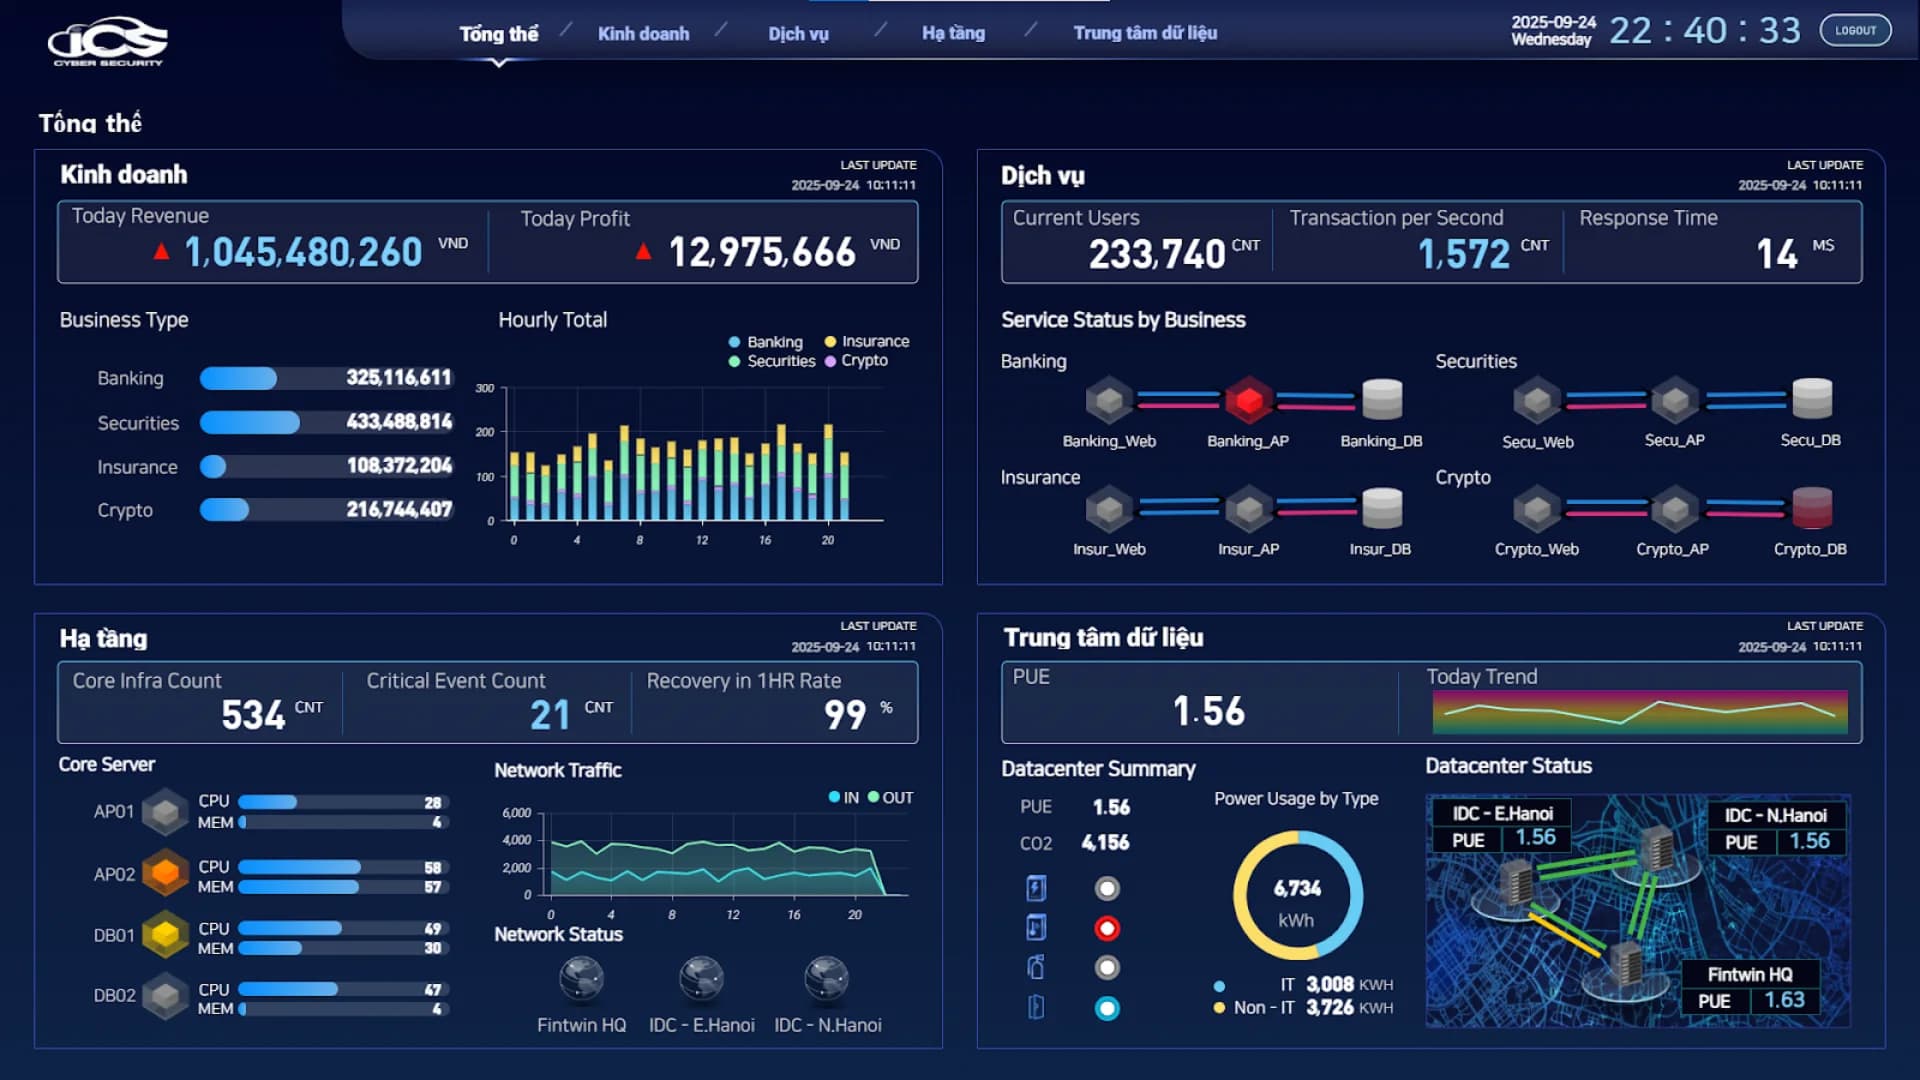
One pass through four screens of the same system. No cuts, no motion-graphics reconstruction.
For physical infrastructure, knowing a threshold was crossed is not enough to act on — you also need to know where. All four scenes below run on the same platform as the 2D screens.
Government·Finance·Manufacturing·Buildings·Seaports
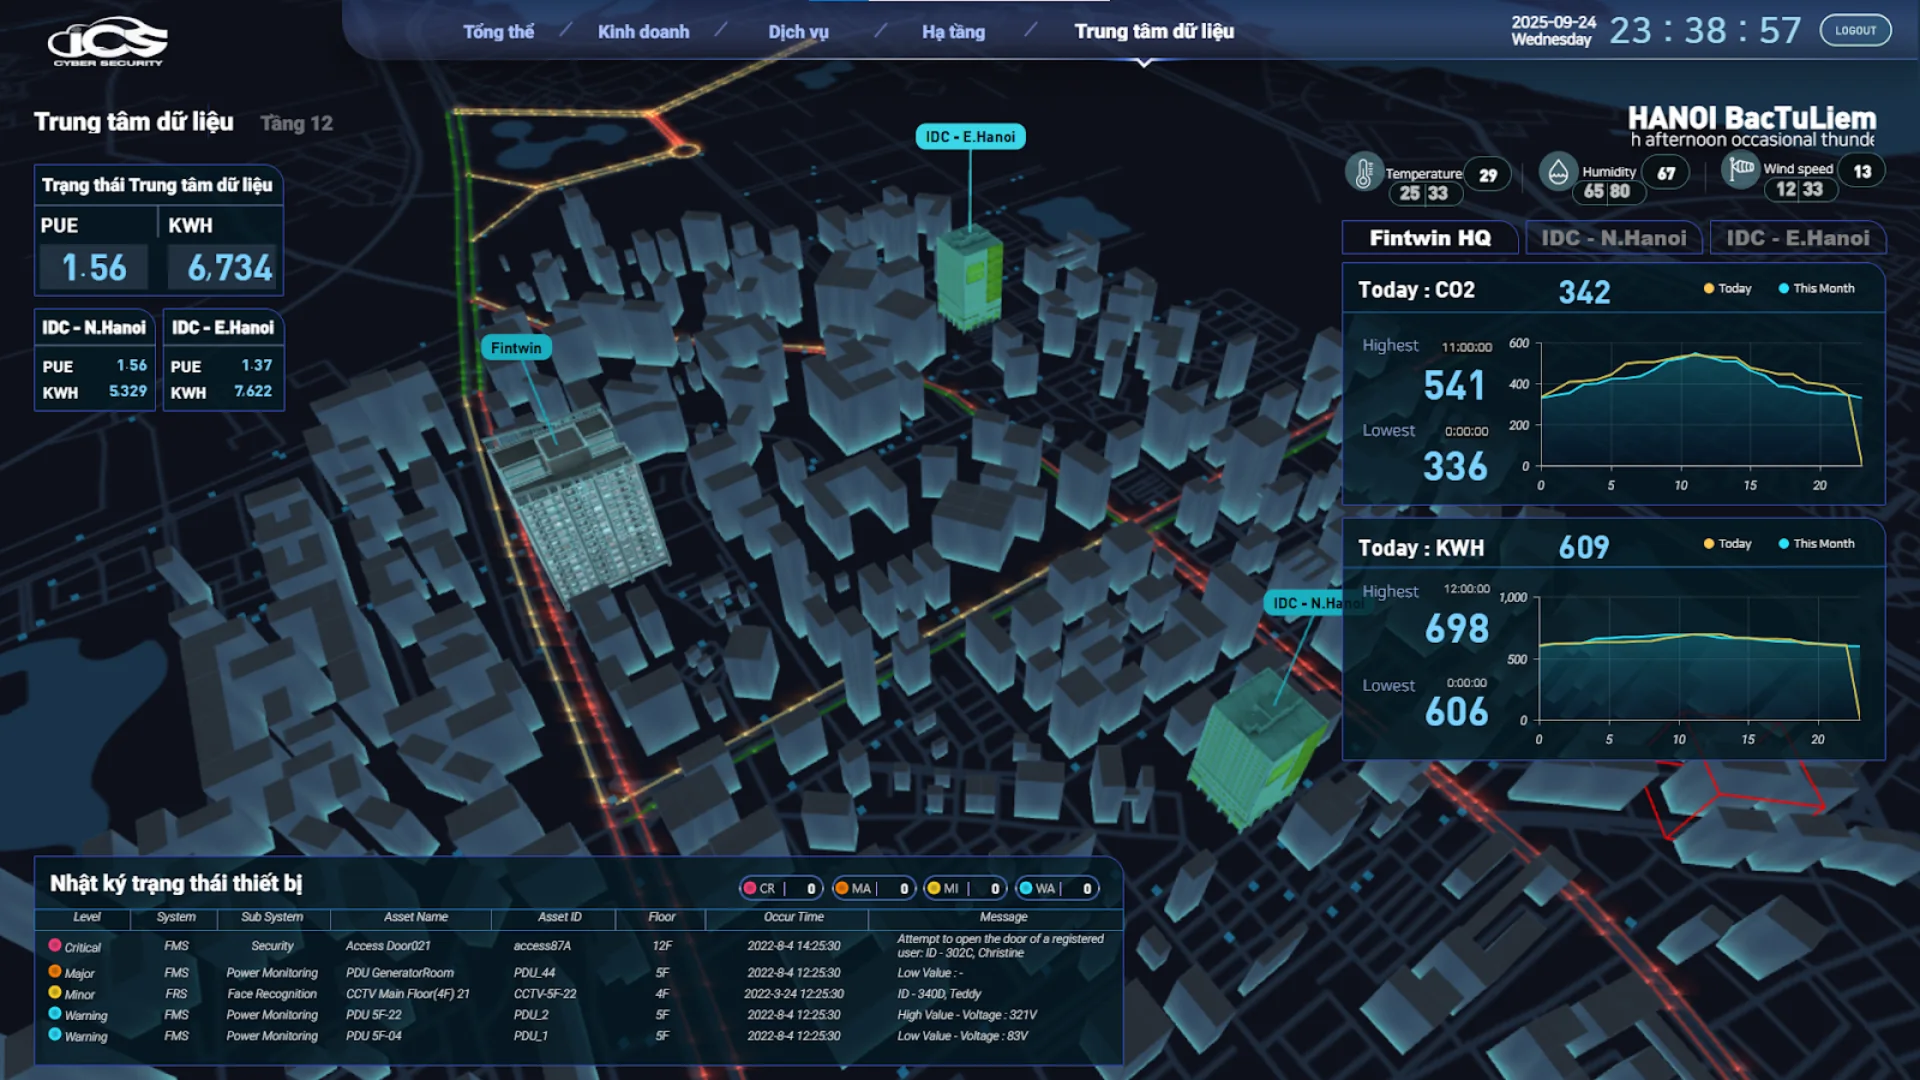
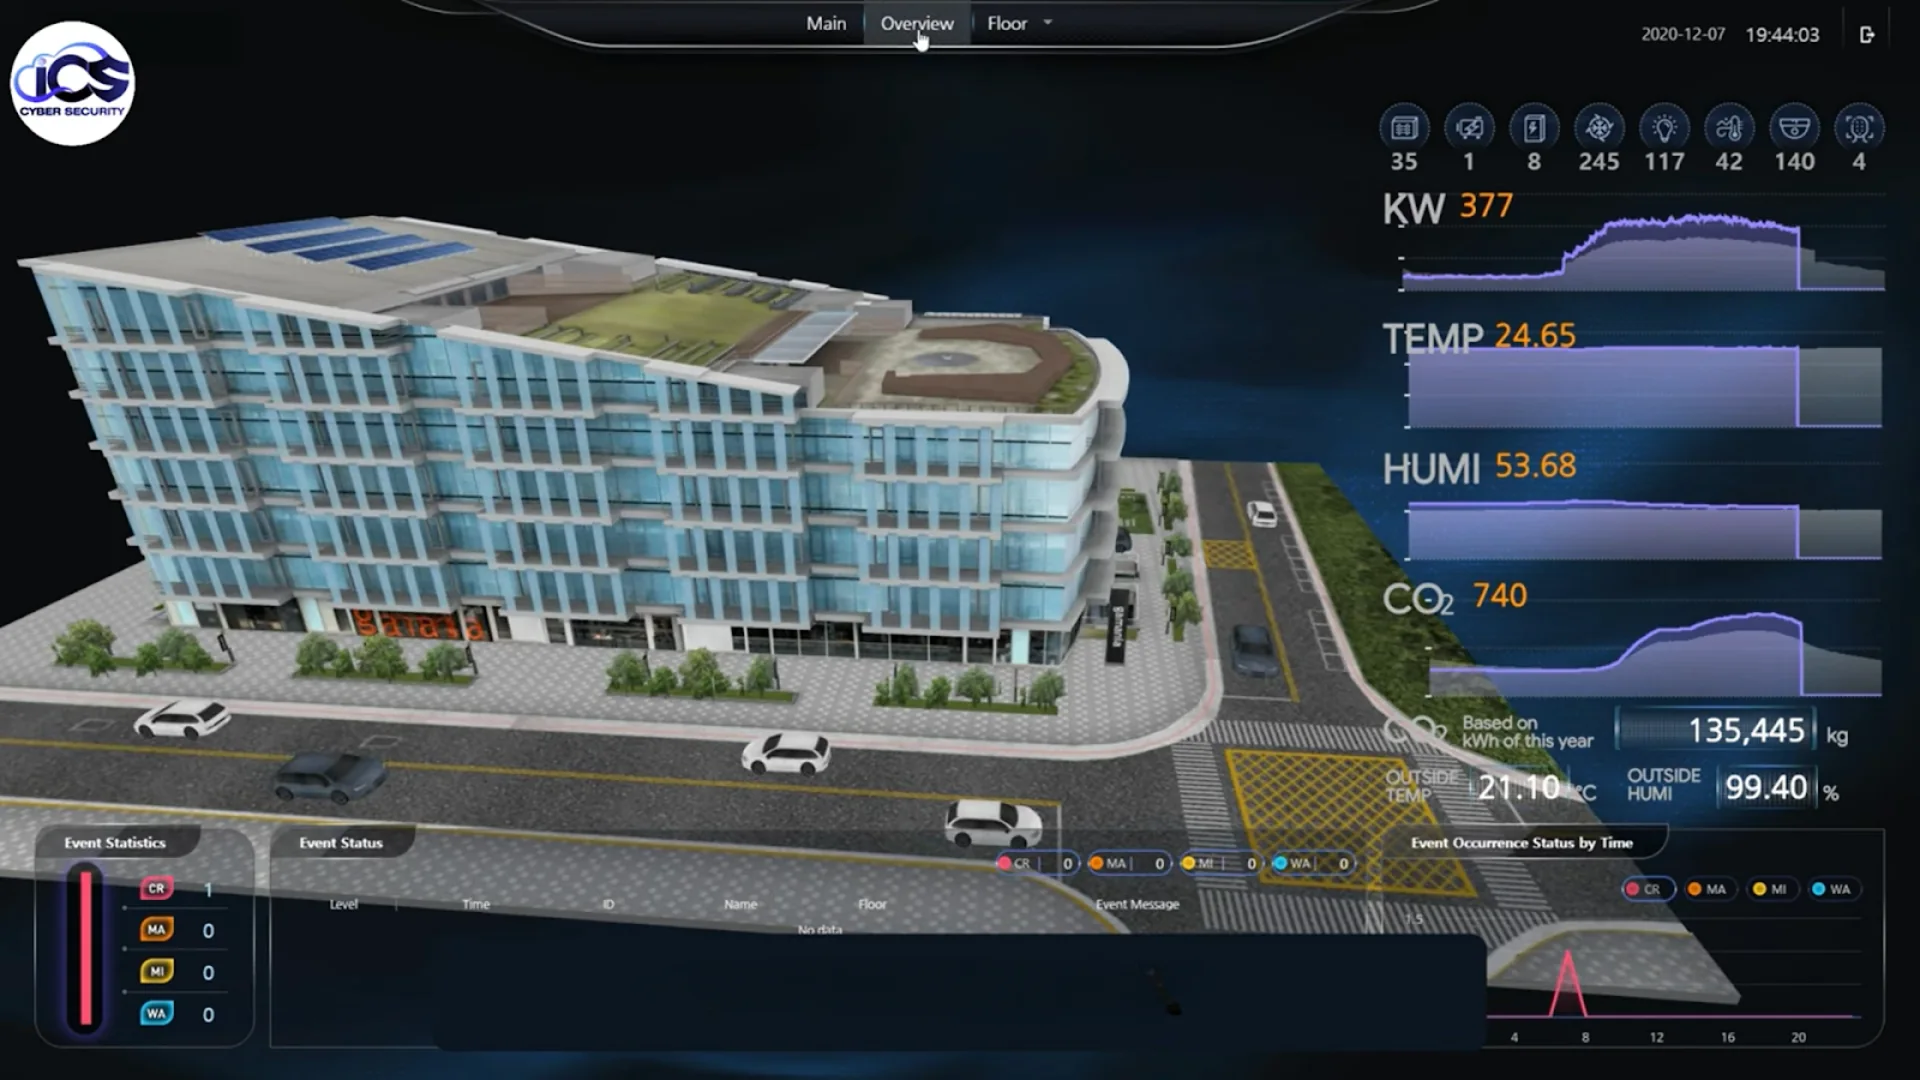
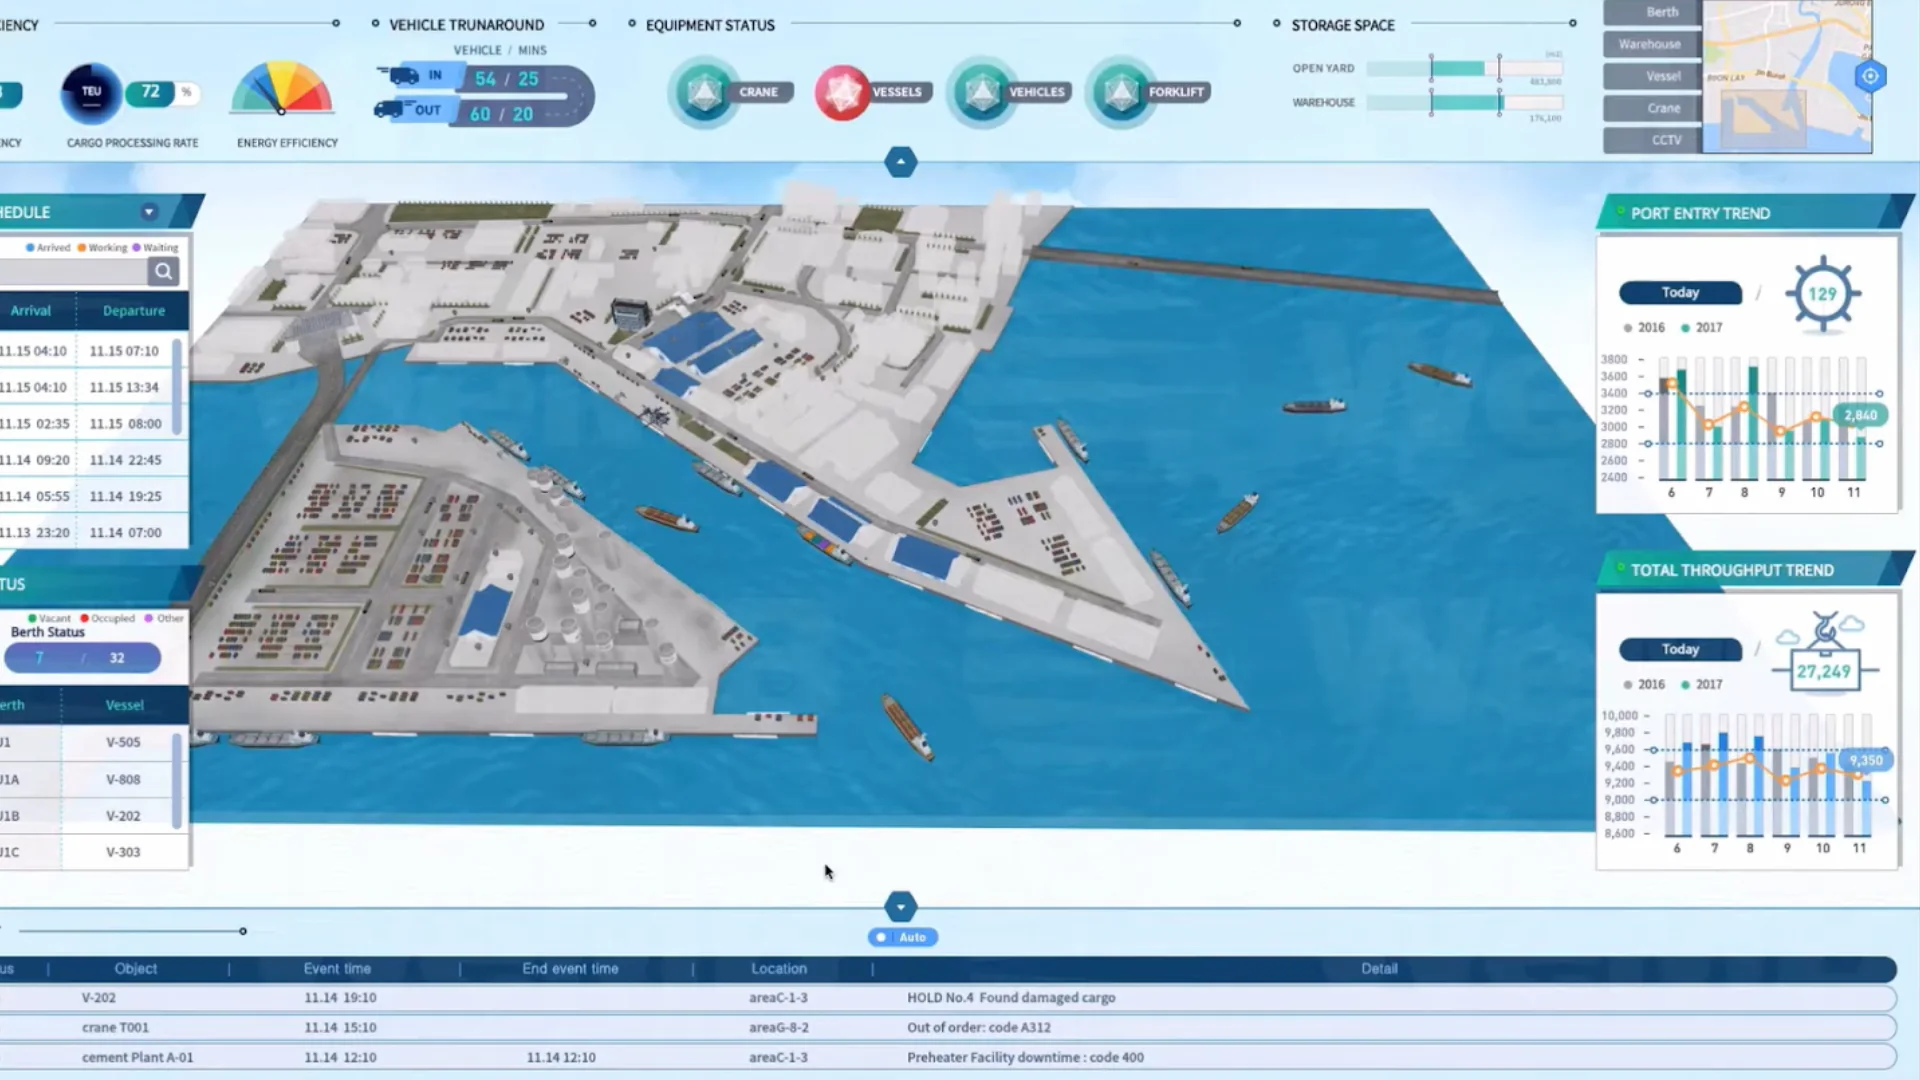
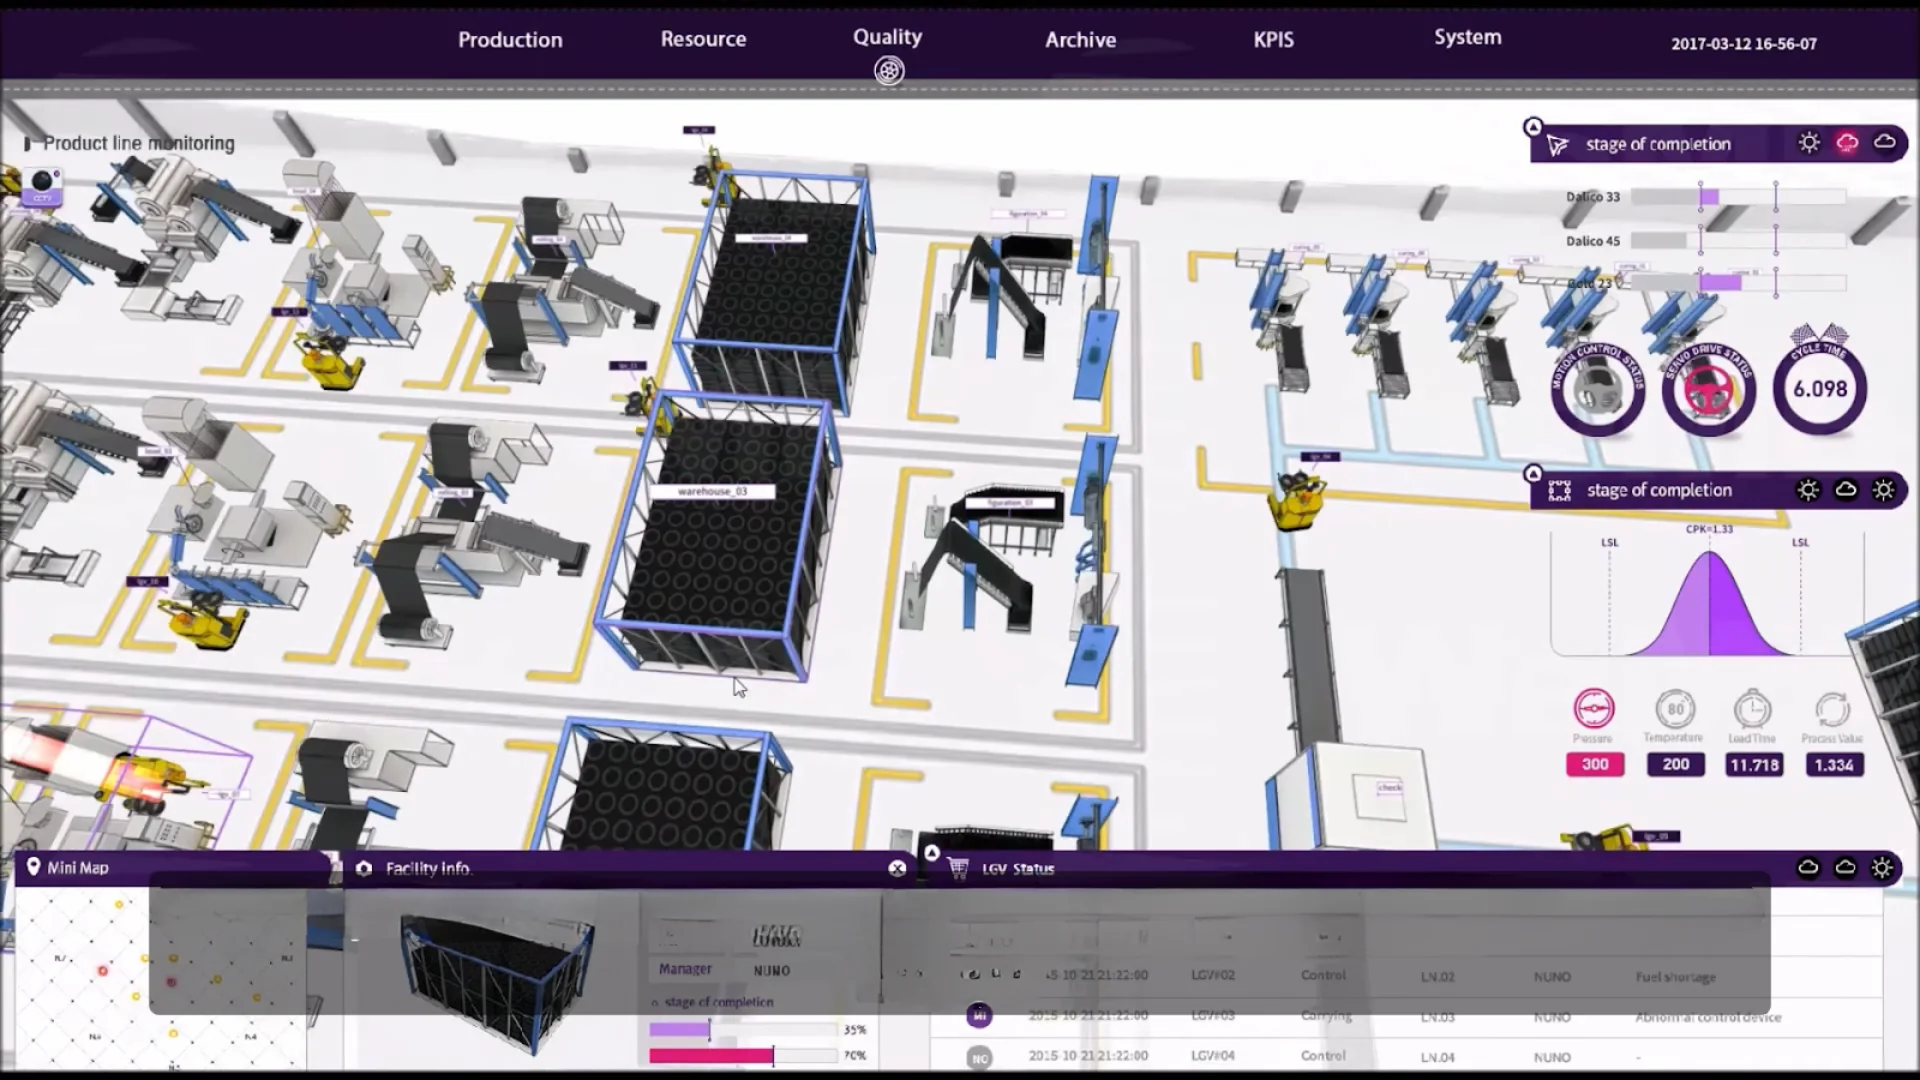
Figures shown in these images are demo data.
Nothing running has to be replaced. Start with one department whose data has a clear source and a clear owner, then extend.
Visualisation makes data easier to read; it does not make it correct. Before screens are built, a project needs a clear source per metric, a named owner, and a reconciliation rule. ICS does that first, and says so upfront when the current data is not ready to be shown.
Every configuration differs, so there is no list price. The three levels below tell you where you sit.
Reports from several departments in one place.
Choose when you still assemble reports by hand.
Near real-time metrics, alerts split by role.
Choose when the numbers are scattered across systems.
Everything in 2D, plus a 3D model of the real site.
Choose when you need to know which floor or device it is on.
One payment, perpetual usage licence.
Cost spread across the chosen term.
No. Smart Dashboard reads from existing systems through databases, APIs, or device protocols. Source systems stay as they are.
It depends on the number of sources and how ready the data is, not on building the interface. Where sources are clear and reachable, the first screen comes quickly; where definitions still have to be cleaned up and agreed, that work is the bulk of the timeline. ICS estimates after reviewing your system list.
Yes, and usually you should. Start with a department whose data has a clear source and owner, run it for real, then extend to others on the same platform.
No. The dashboard shows exactly what the source provides. A project has to settle sources, owners, and reconciliation rules before visualisation, otherwise it only displays wrong numbers faster.
By number of sources, screens and roles, whether 3D modelling is included, the scope of monitored infrastructure, purchase versus subscription, and the support scope. A quote needs a defined configuration.
Tell us which systems you run and what you need to watch. ICS replies during business hours.
International Cyber Security Joint Stock Company
TT3-5 Dai Kim Moi Urban Area, Dinh Cong, Hanoi